VESTIBULOCOCHLEAR NERVE
Objective:
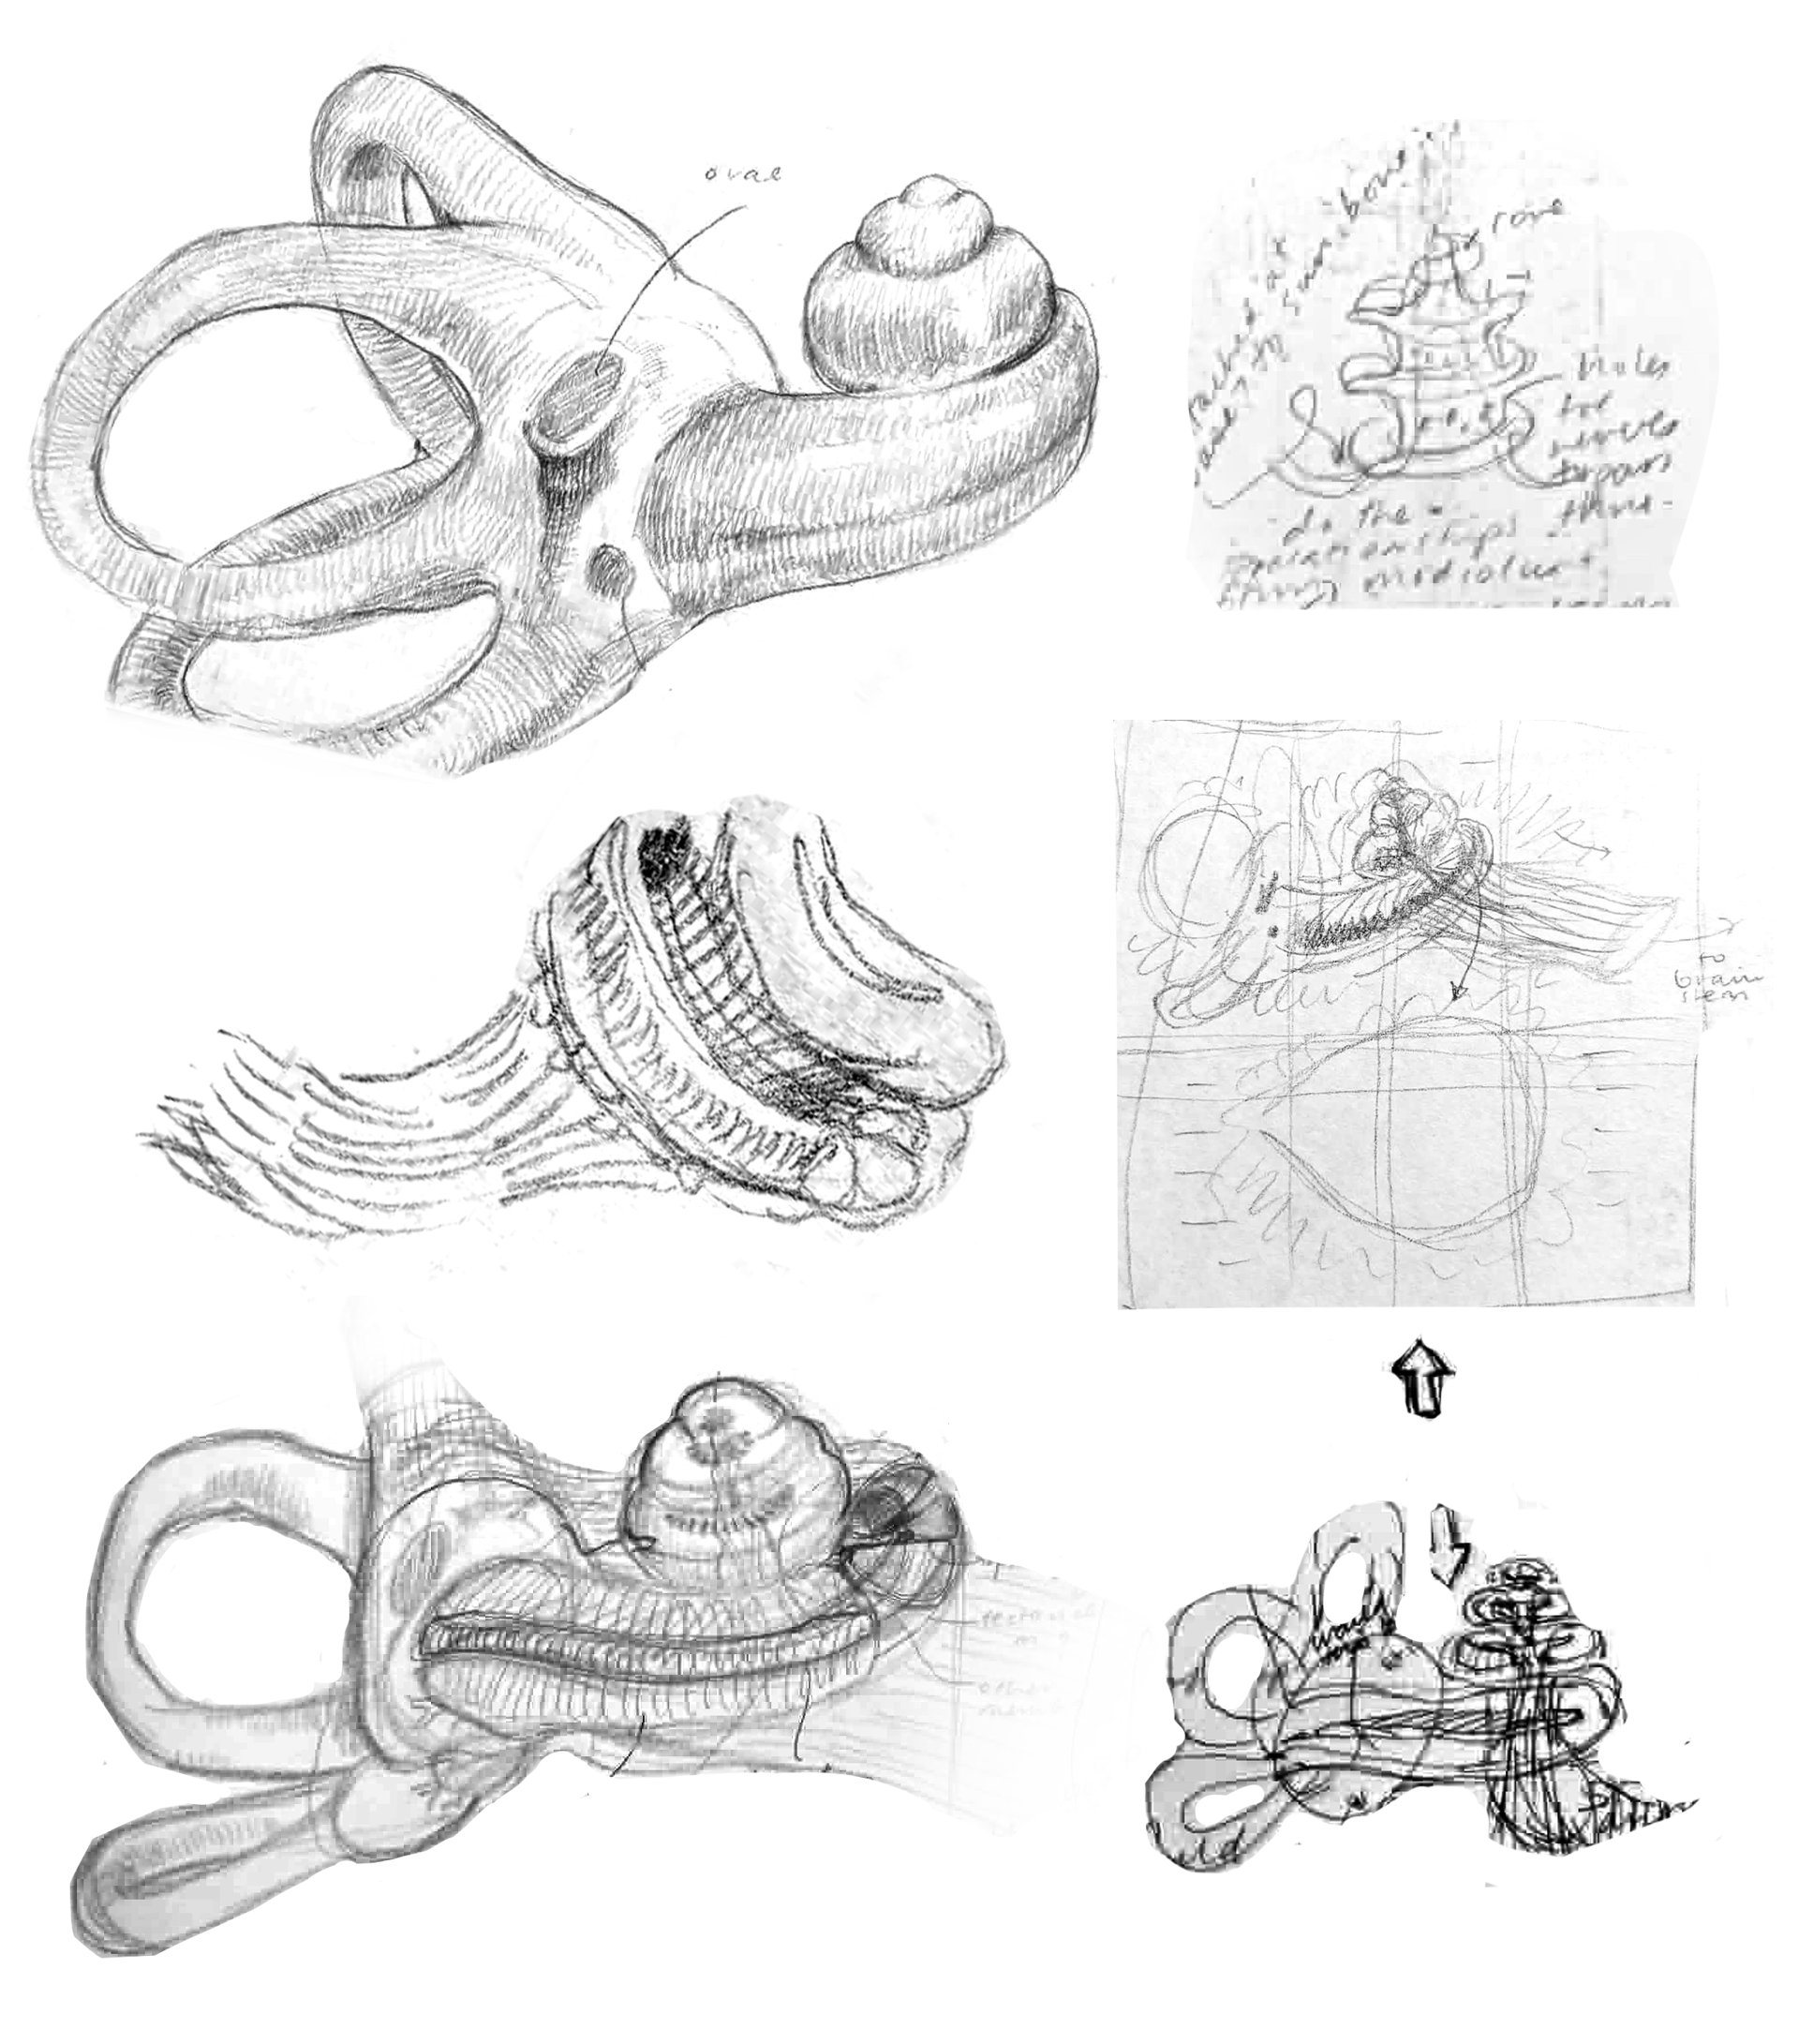
Use recent synchrotron radiation phase-contrast imaging to inform a more detailed illustration of the vestibulocochlear nerve pathway for anatomy learners, to bridge levels in scale and aid understanding.
Work to date:
Reviewed several 3D visualizations produced through synchrotron radiation phase-contrast imaging, Cone Beam Computed Tomography (CBCT), micro-CT, CT, and MRI datasets. Brought available datasets into 3D Slicer and Blender to further understand the relationships between structures. Supplemented research with videos and photos from dissections and surgeries, SEM and histology images, and illustrations of bone cross sections.
Identifying a FocuS
Many illustrations of the vestibulocochlear nerve show its hard-to-understand pathway (due to the complex structures and dramatic changes in scale) by using different views and sections of anatomy. I wondered: could I bring more detail to the macro view? Could this help bridge some levels of scale and aid understanding?
Challenges
The 3D internal structure of the cochlea is incredibly complex (involves several detailed structures such as the cochlear duct, scala tympani, scala vestibuli, spiral lamina, modiolus...).
Creating a visualization of the cochlea raises the question of how (or whether?) to show how the cochlea and semicircular canals are hollow spaces (bony labyrinths).
Given the complex context for these structures and pathways - what is helpful context for a learner? What is distracting?
MAIN REFERENCES
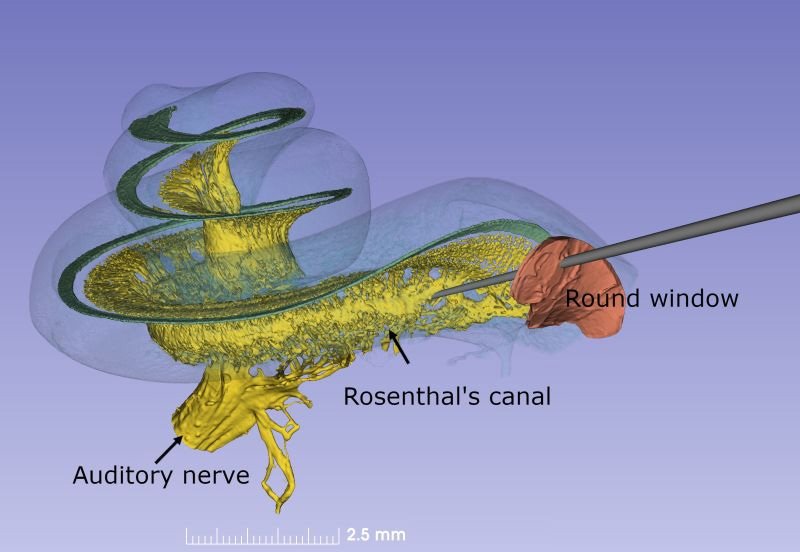
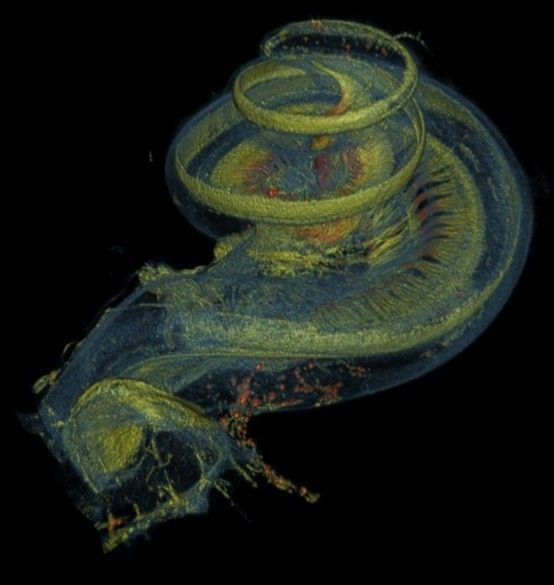
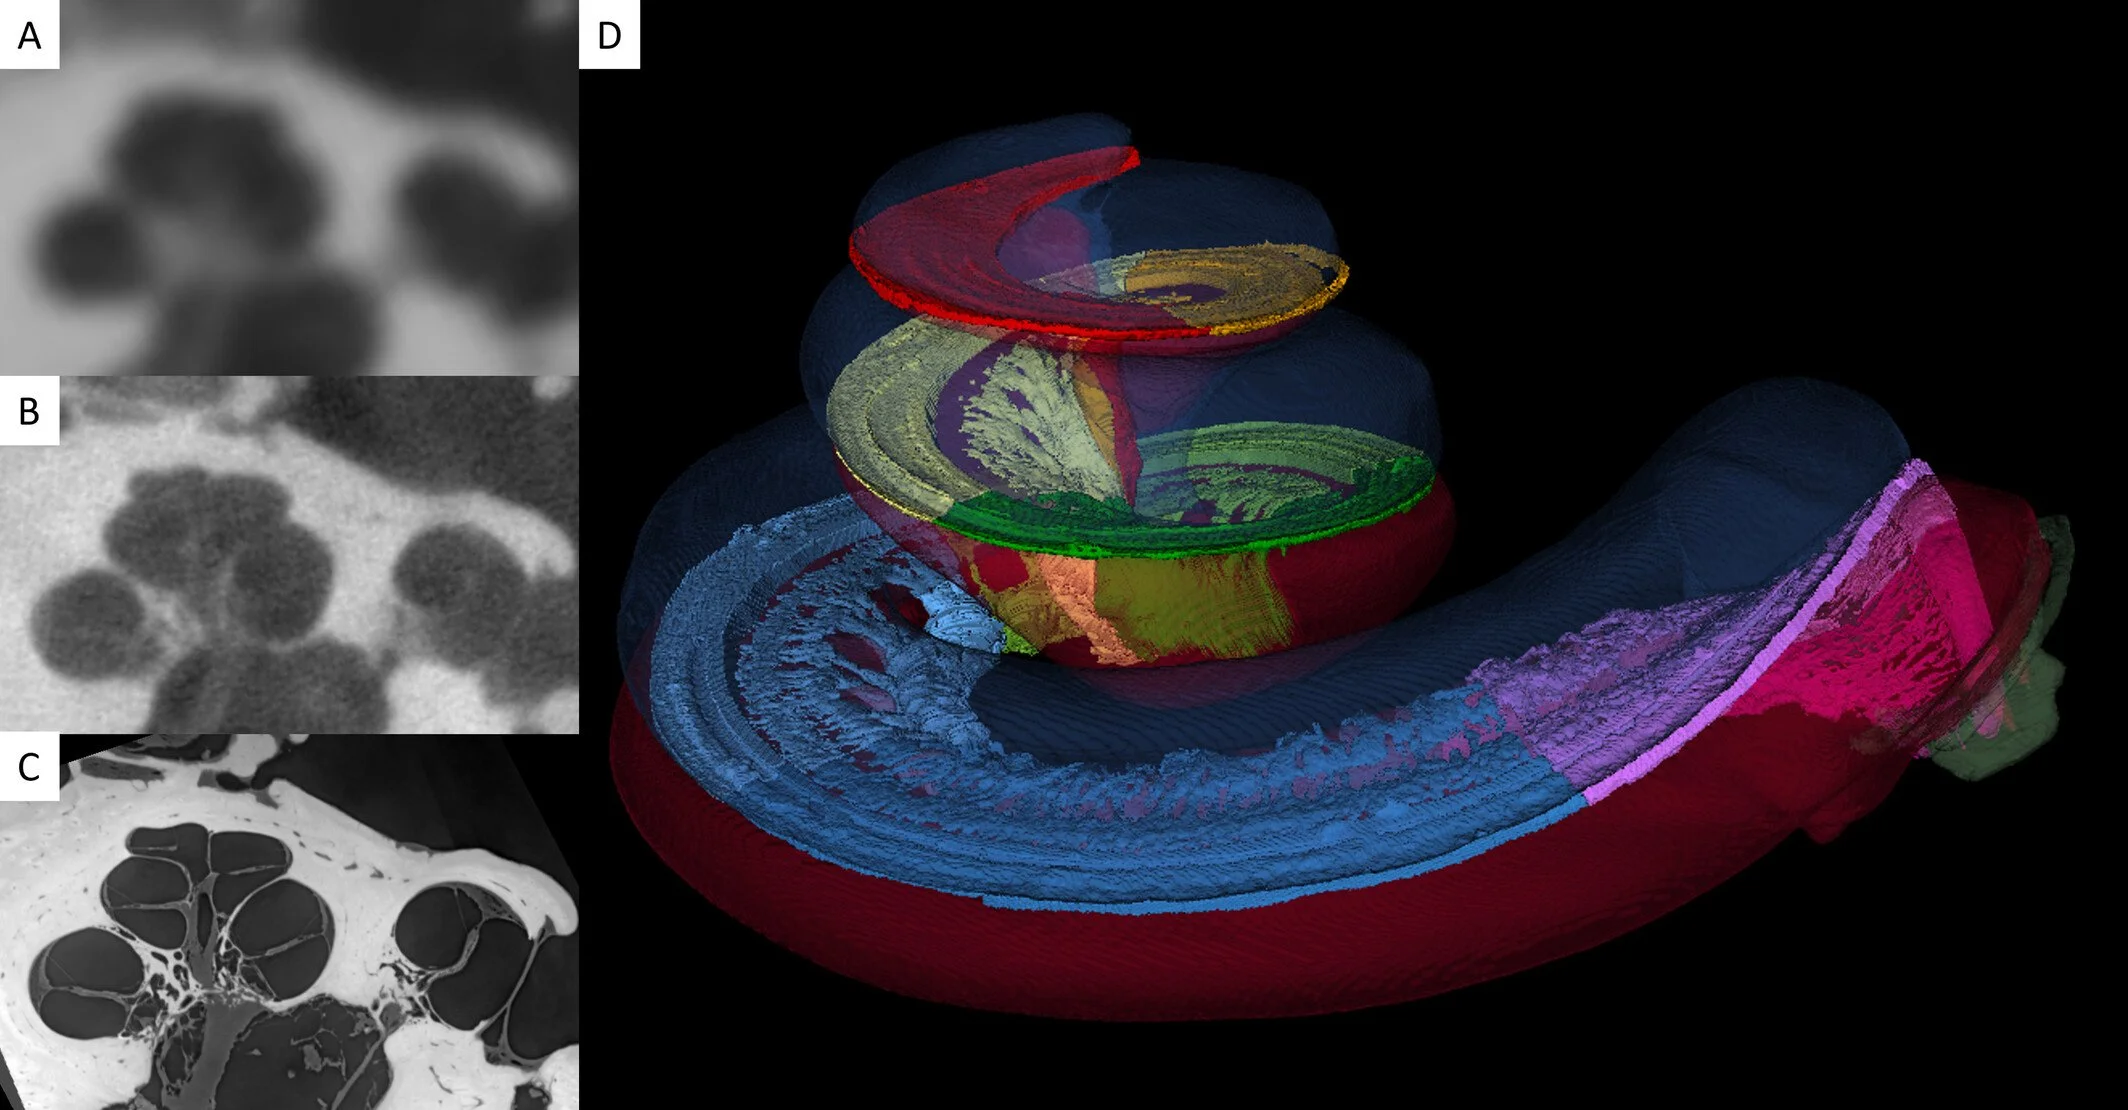
Synchrotron radiation phase-contrast imaging:
Incredibly detailed views of the vestibulocochlear nerve, including the spiral ganglion, and very small internal structures adjacent to the spiral lamina
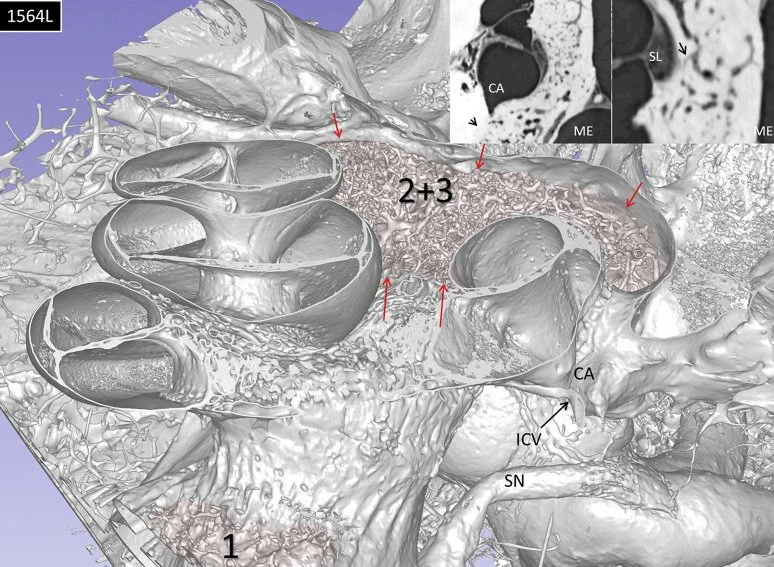
Cone Beam Computed Tomography (CBCT):
More detailed datasets with isolated ROIs, which could be brought in to 3D Slicer and manipulated to get an intermediate sense of the relationship between vestibular and cochlear structures, and start to plan a more unique view
Micro-CT scans
To visualize the general relationship between vestibular and cochlear structures, and compare broader range of cochleas
SEM Images:
Provided a detailed view of cells in the cochlea (specifically the organ of Corti)
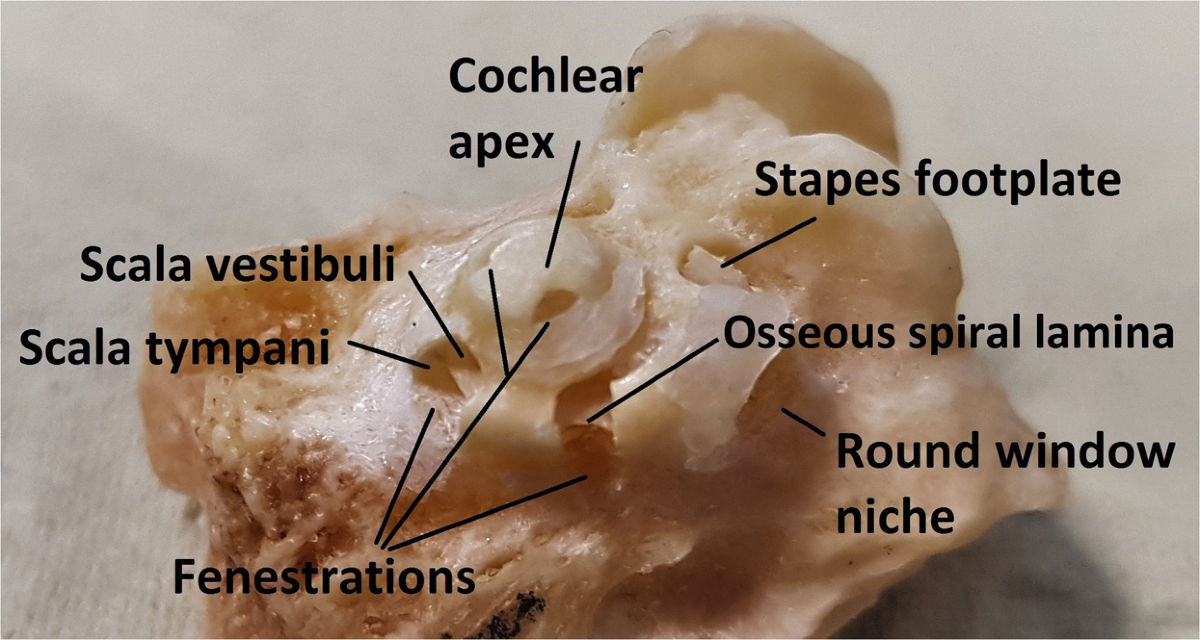
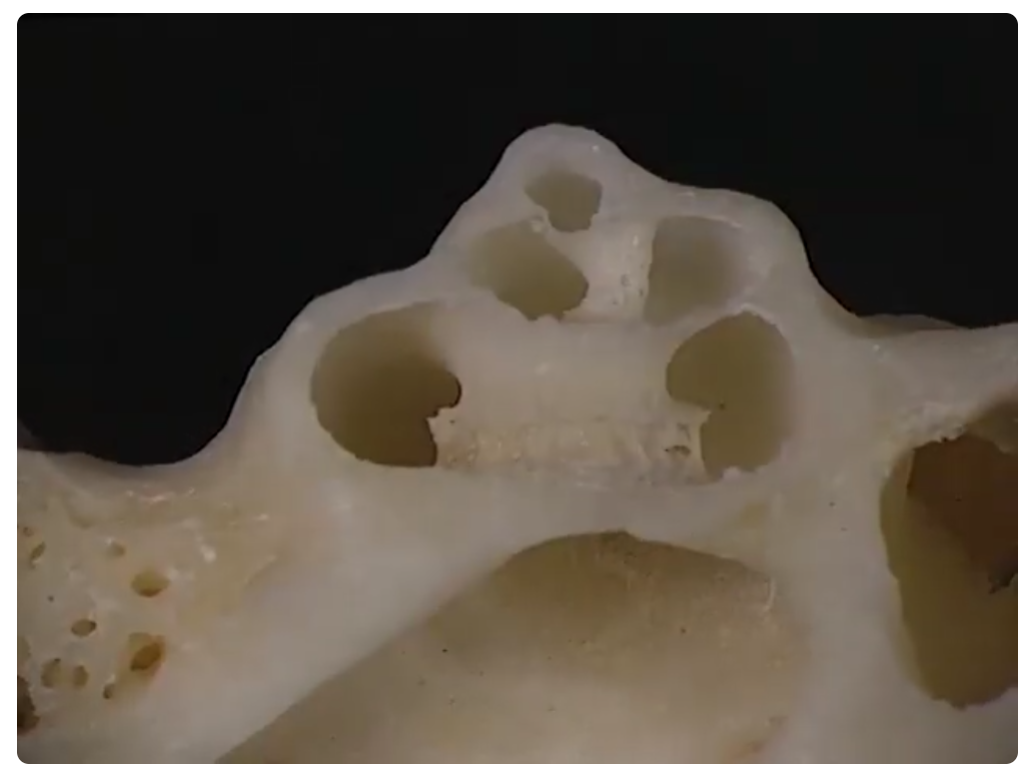
Dissections and drawings of bone cross sections:
Provides unique viewpoints and a detailed sense of the bony spaces
Histology:
More accurate sense of scale and proportion at the cellular level, particularly of the organ of Corti
Full Reference List
(living document)
VISUALIZATIONS FROM 3D DATA

Own visualization in 3D Slicer, from datasets provided by:
Sieber, et. al. (2019). The OpenEar library of 3D models of the human temporal bone based on computed tomography and micro-slicing [Data set]. In Scientific Data (Vol. 6, Number 180297). Zenodo. https://doi.org/10.5281/zenodo.1473724
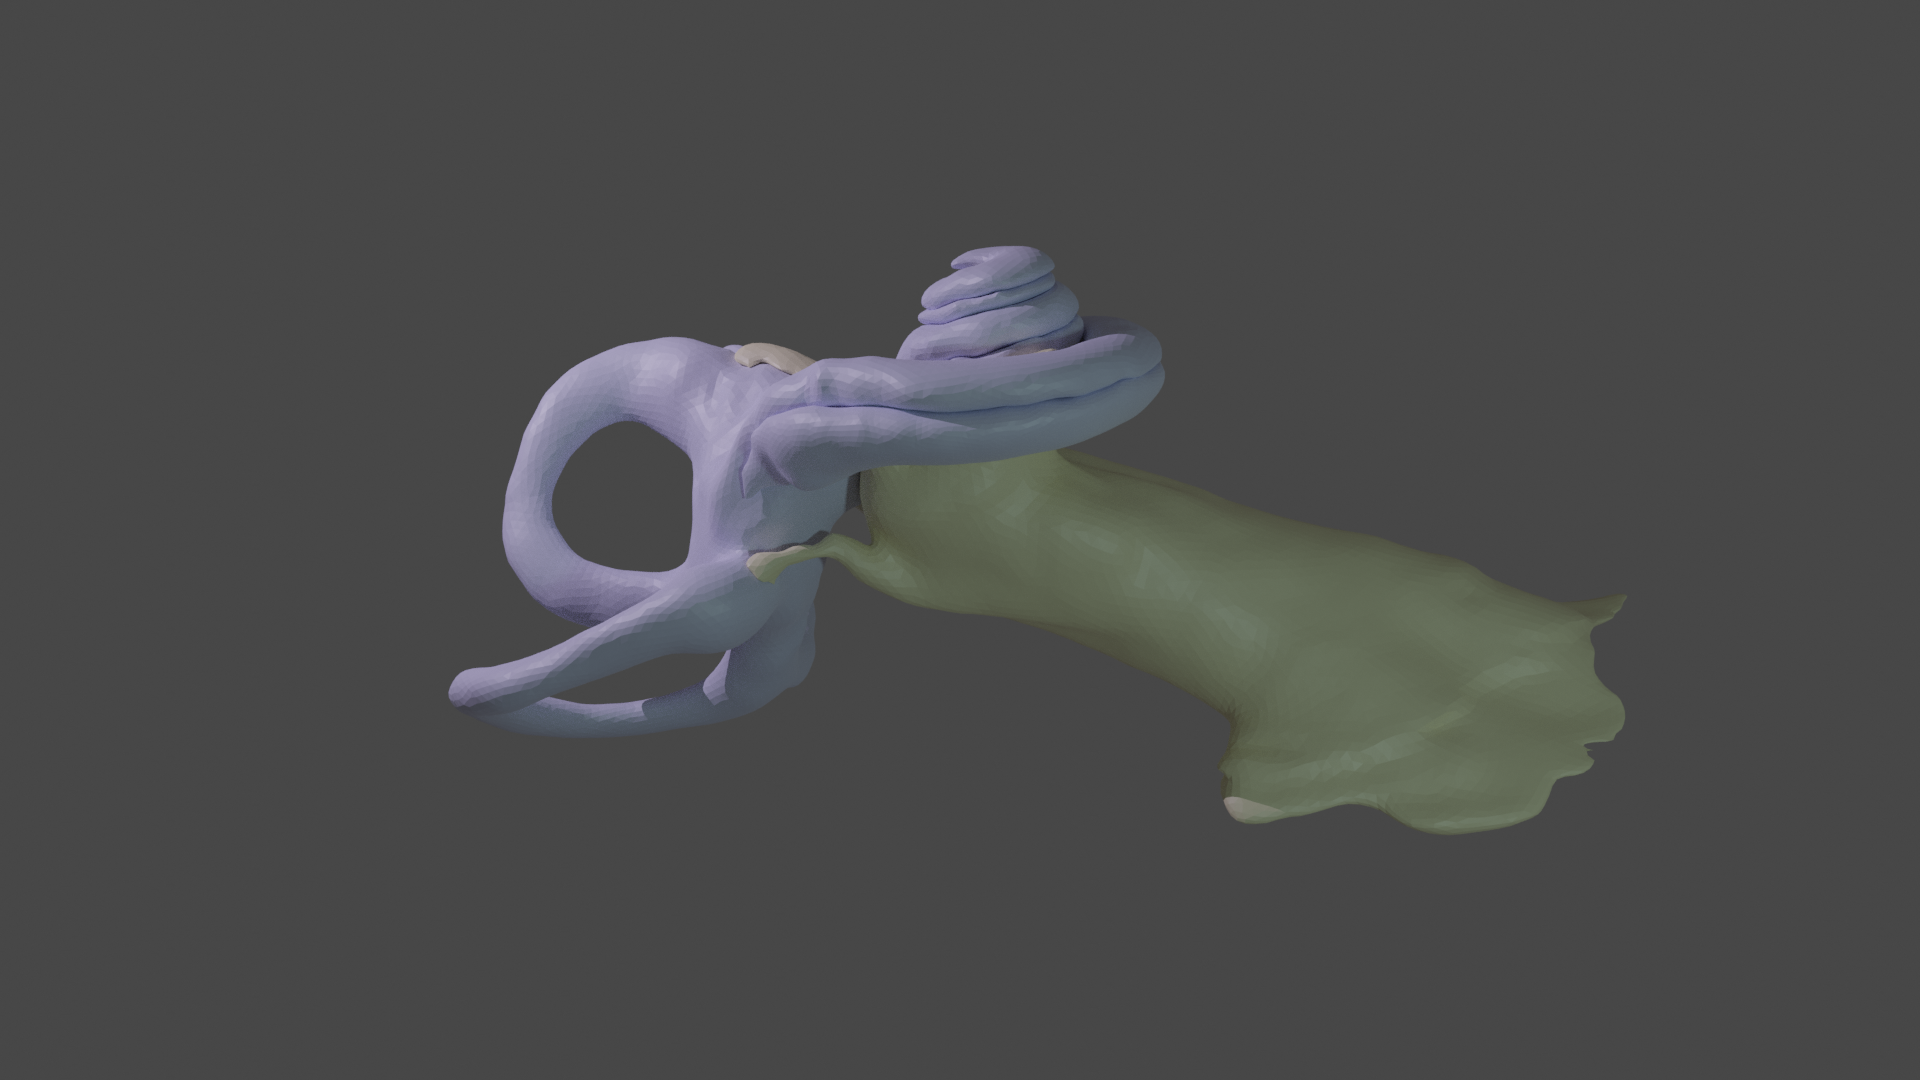
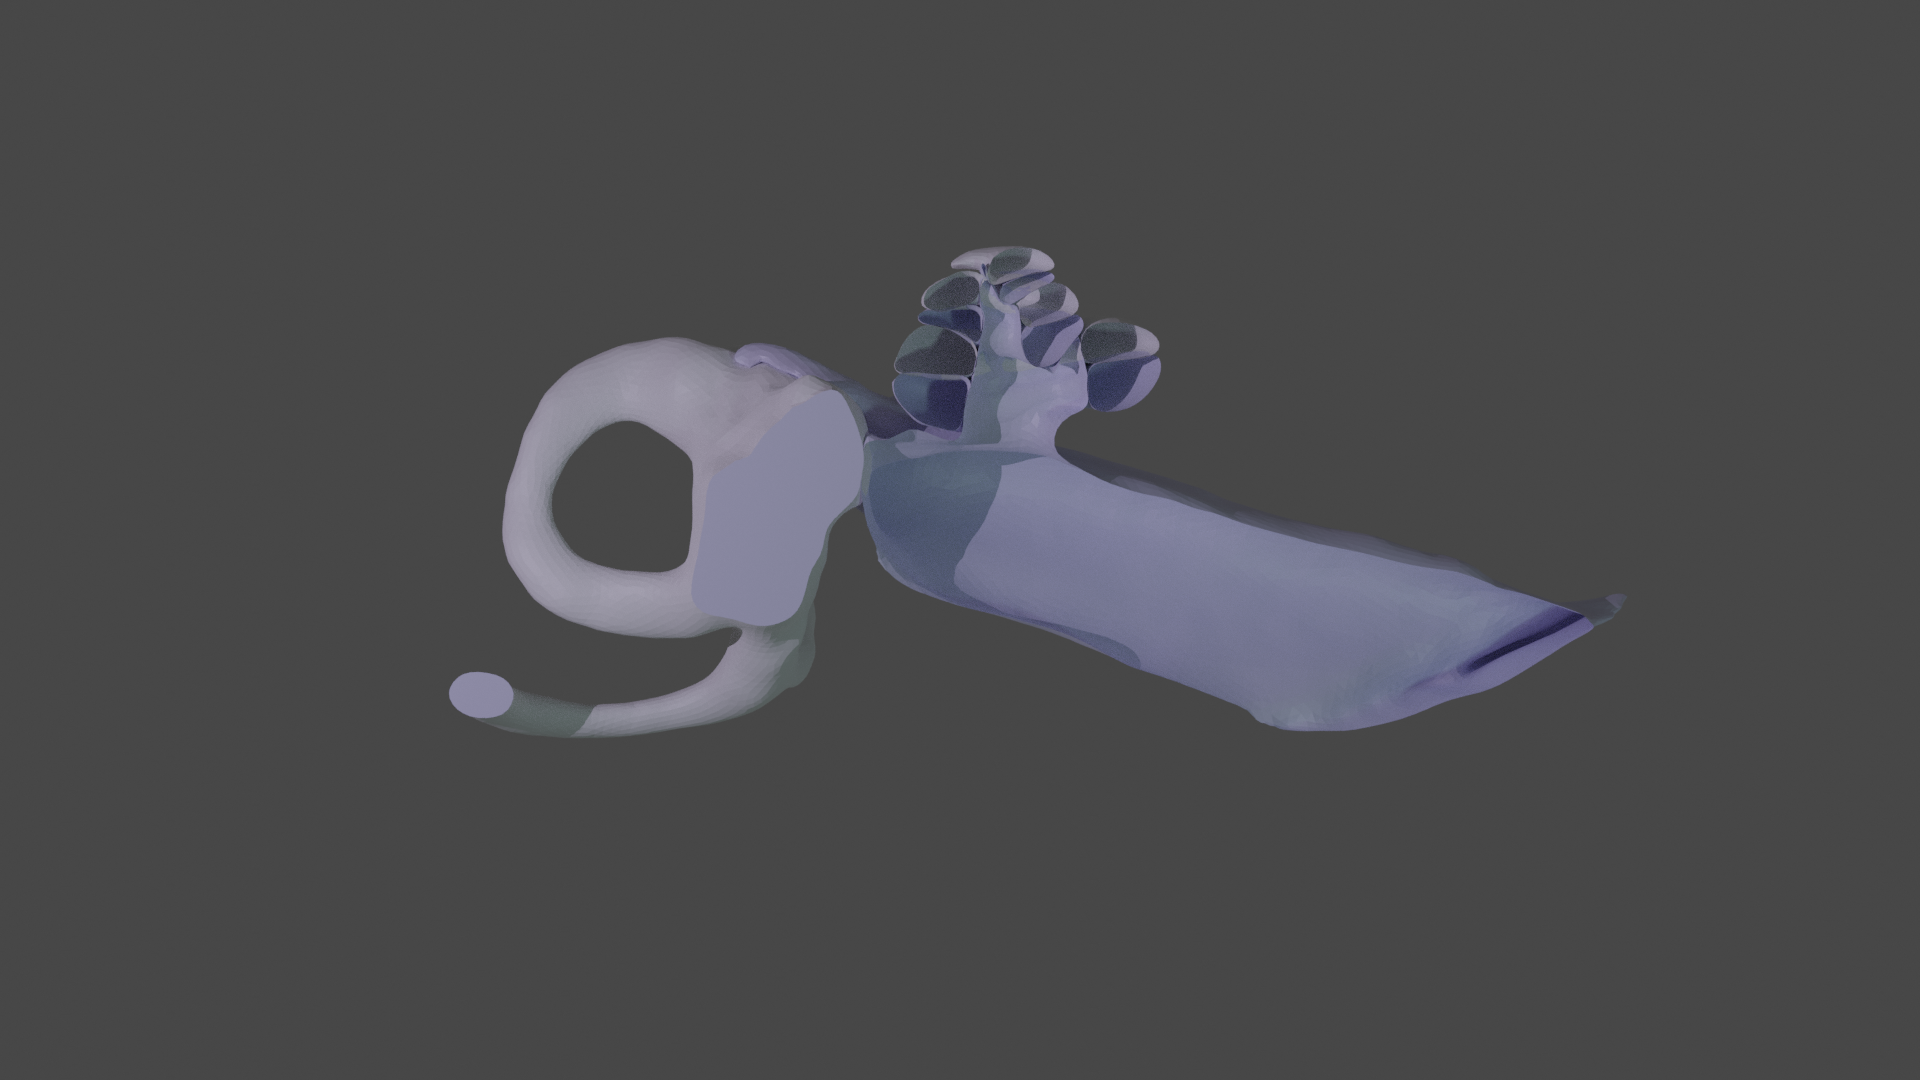
Own visualizations in Blender (in progress), from datasets provided by:
Sieber, et. al. (2019). The OpenEar library of 3D models of the human temporal bone based on computed tomography and micro-slicing [Data set]. In Scientific Data (Vol. 6, Number 180297). Zenodo. https://doi.org/10.5281/zenodo.1473724
SELECT REFERENCE IMAGES
(please see reference list to find sources for images below)