B.C. SALMON AQUACULTURE data visualization
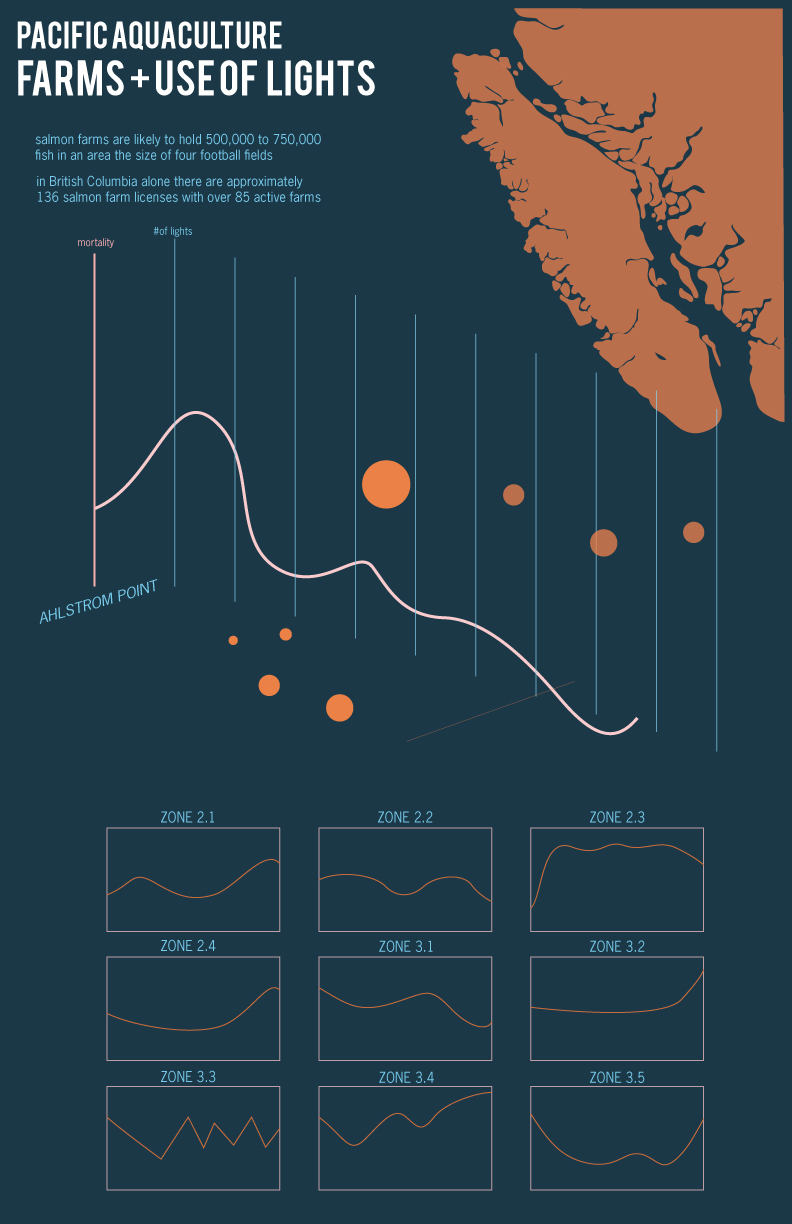
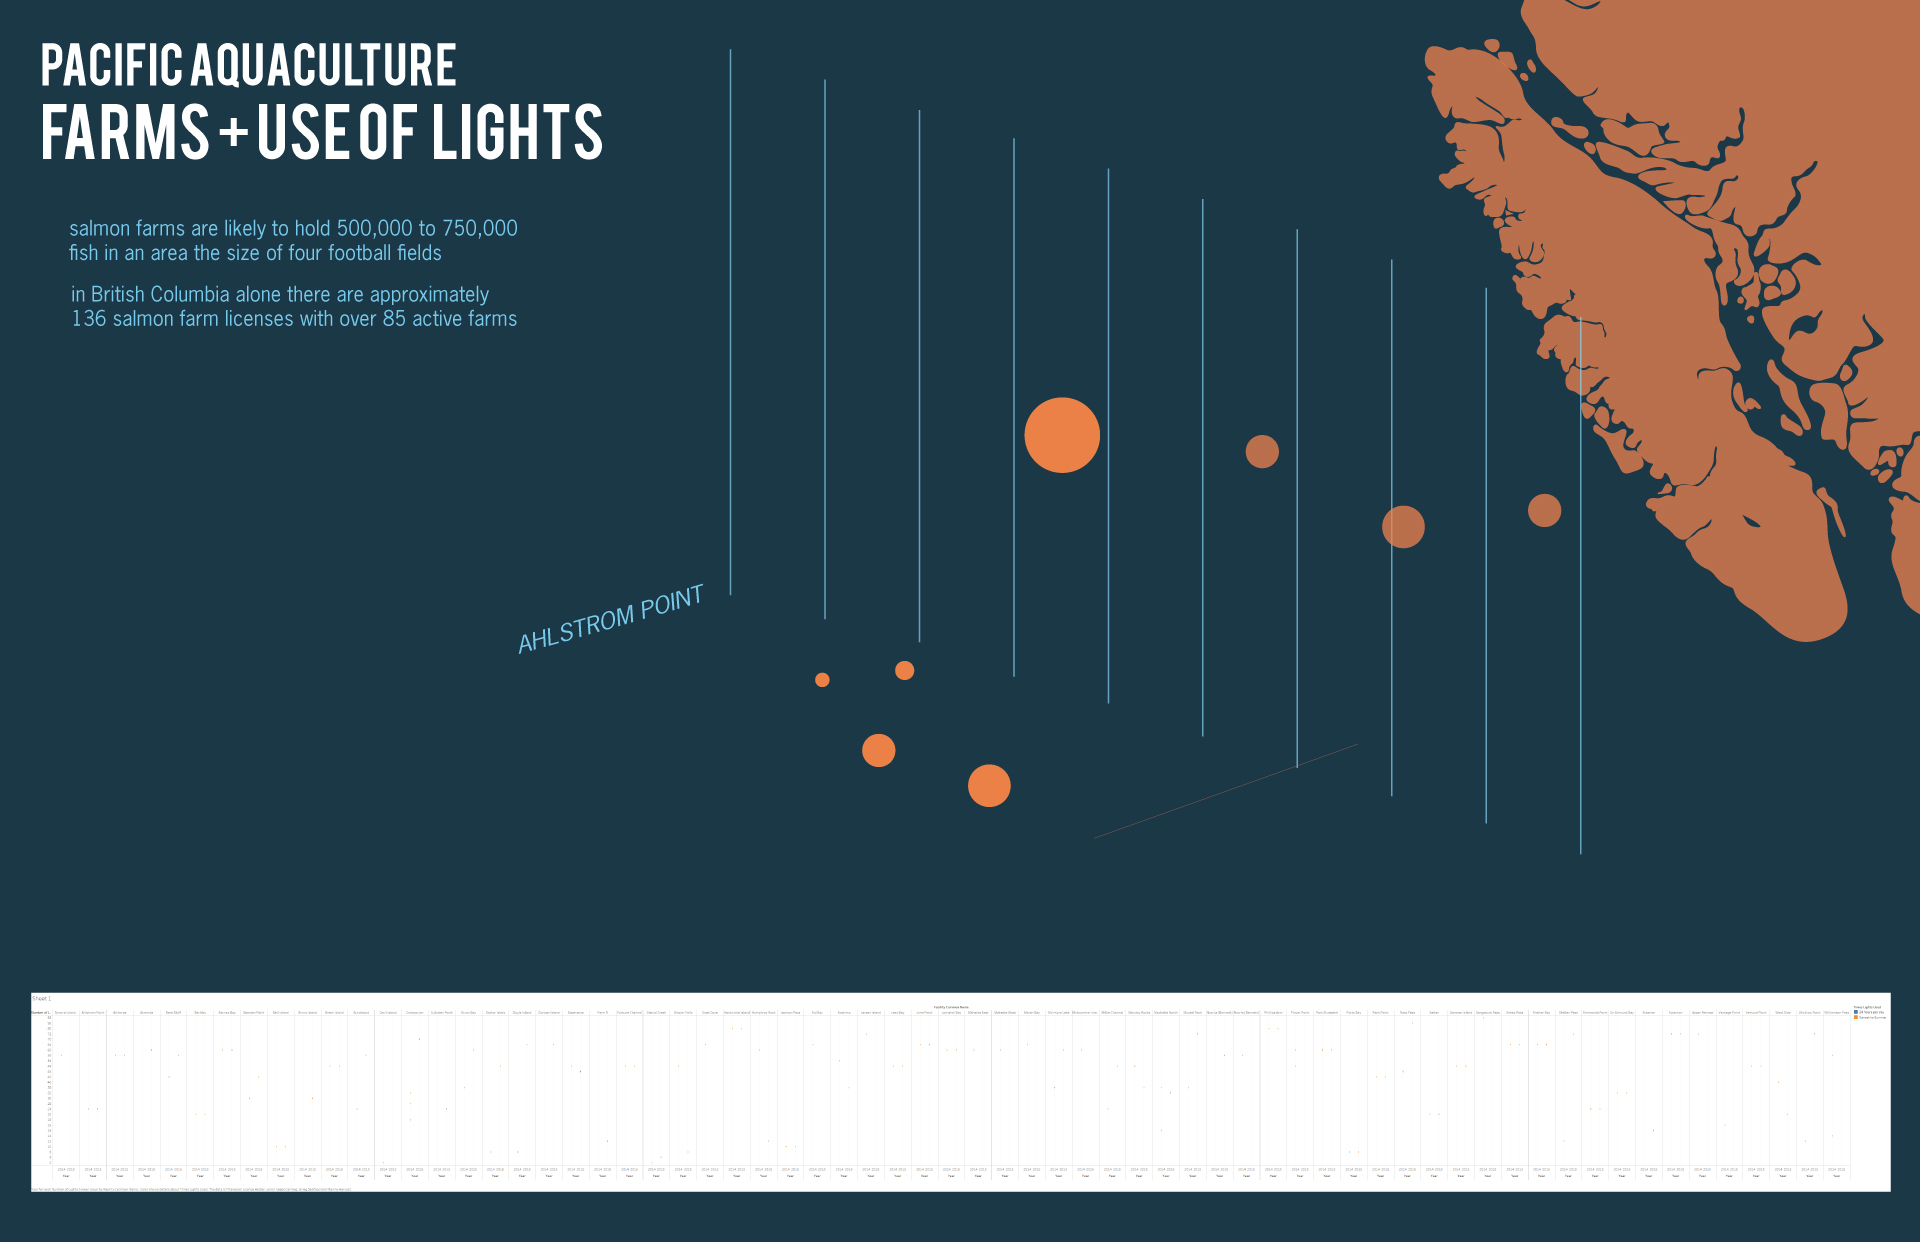
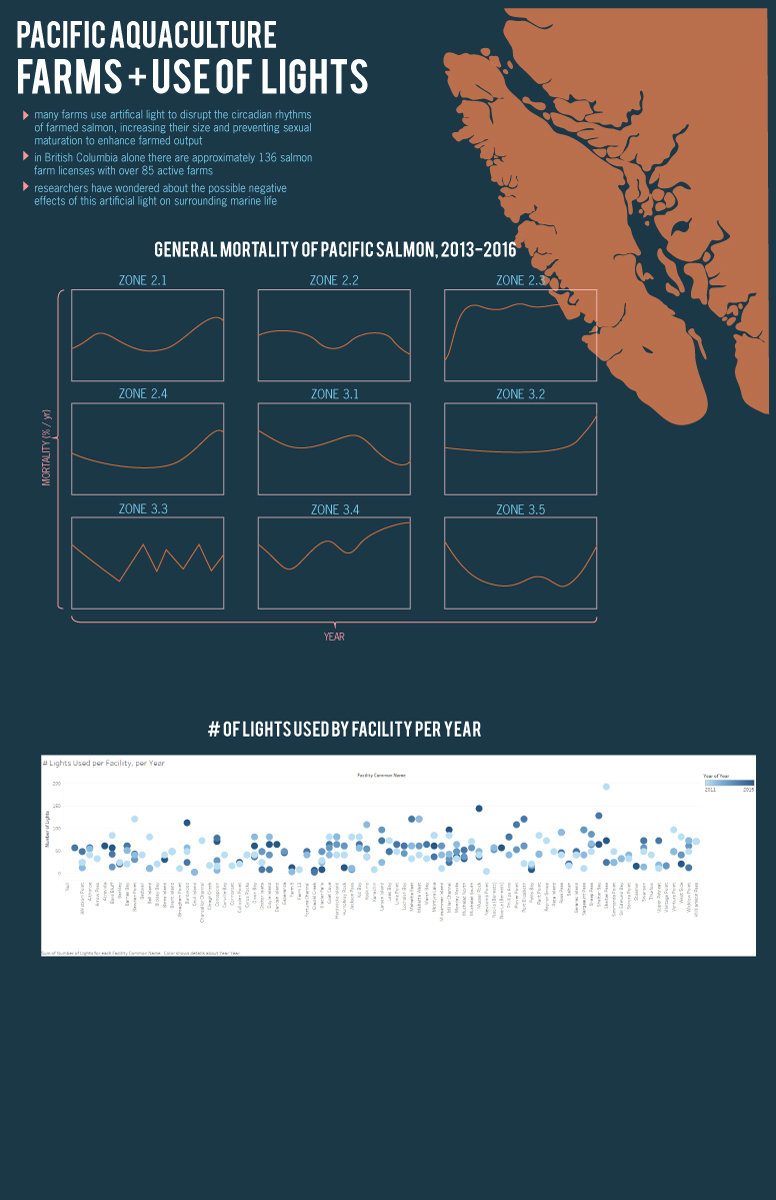
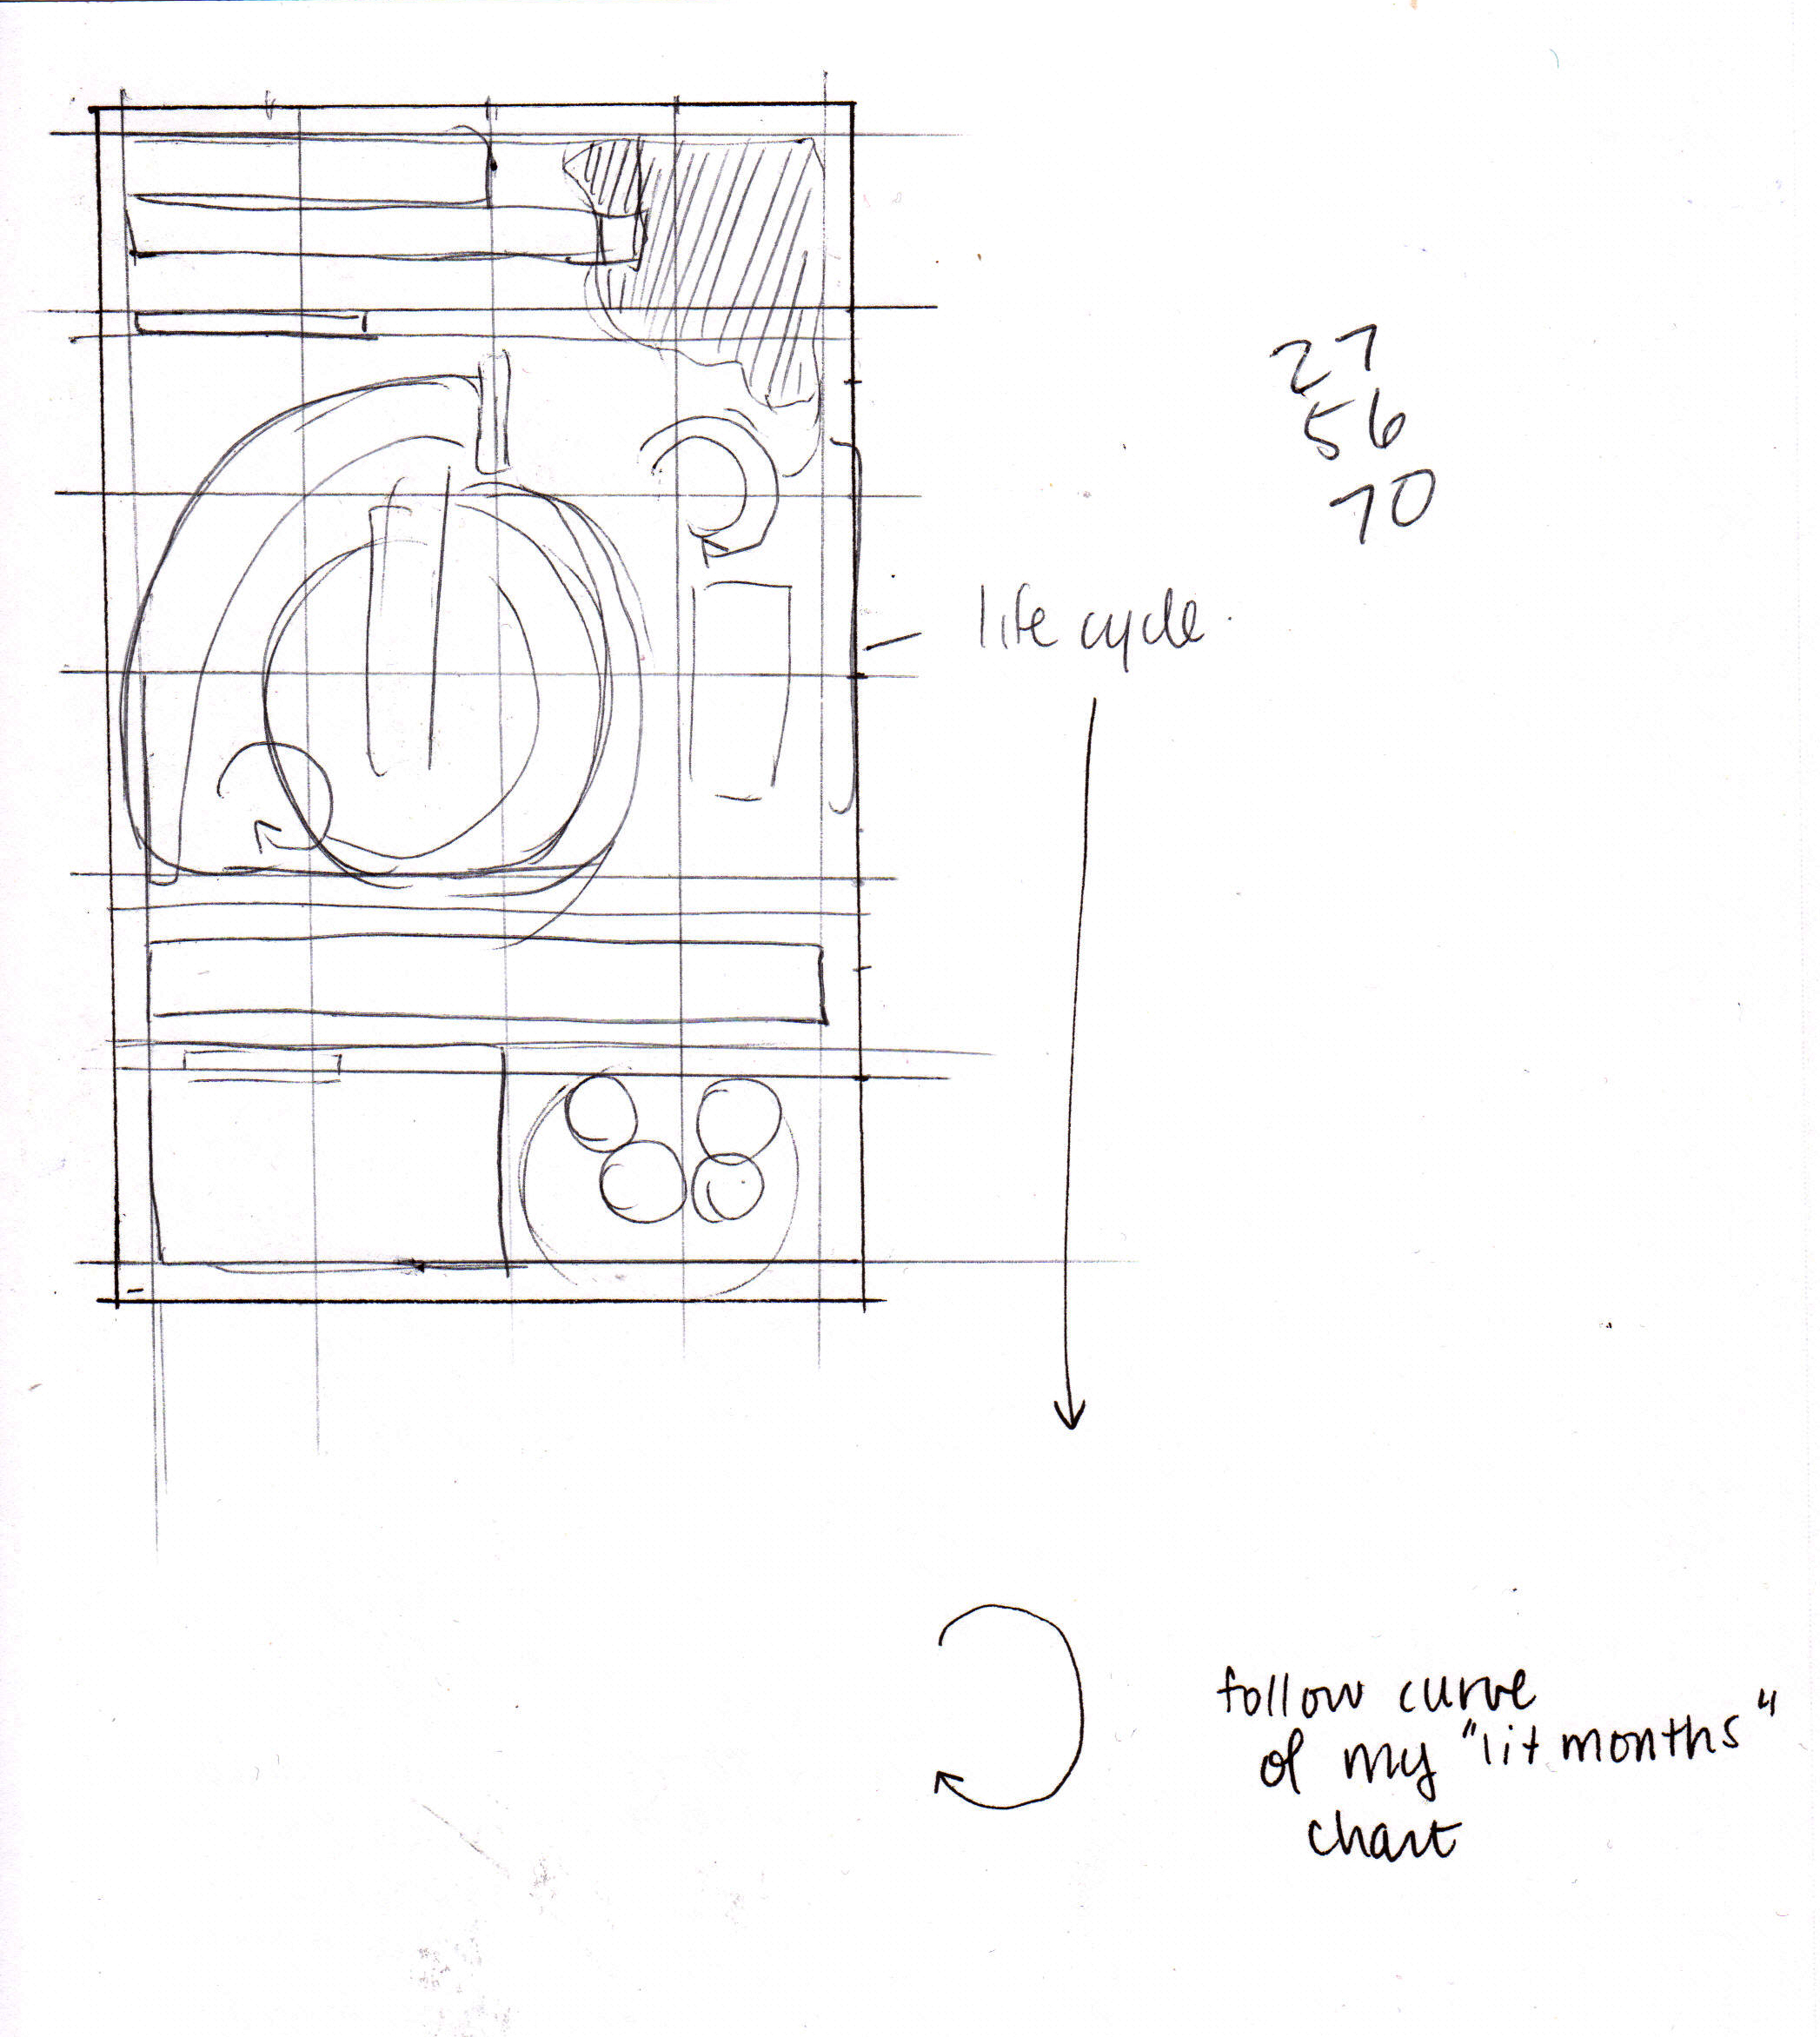
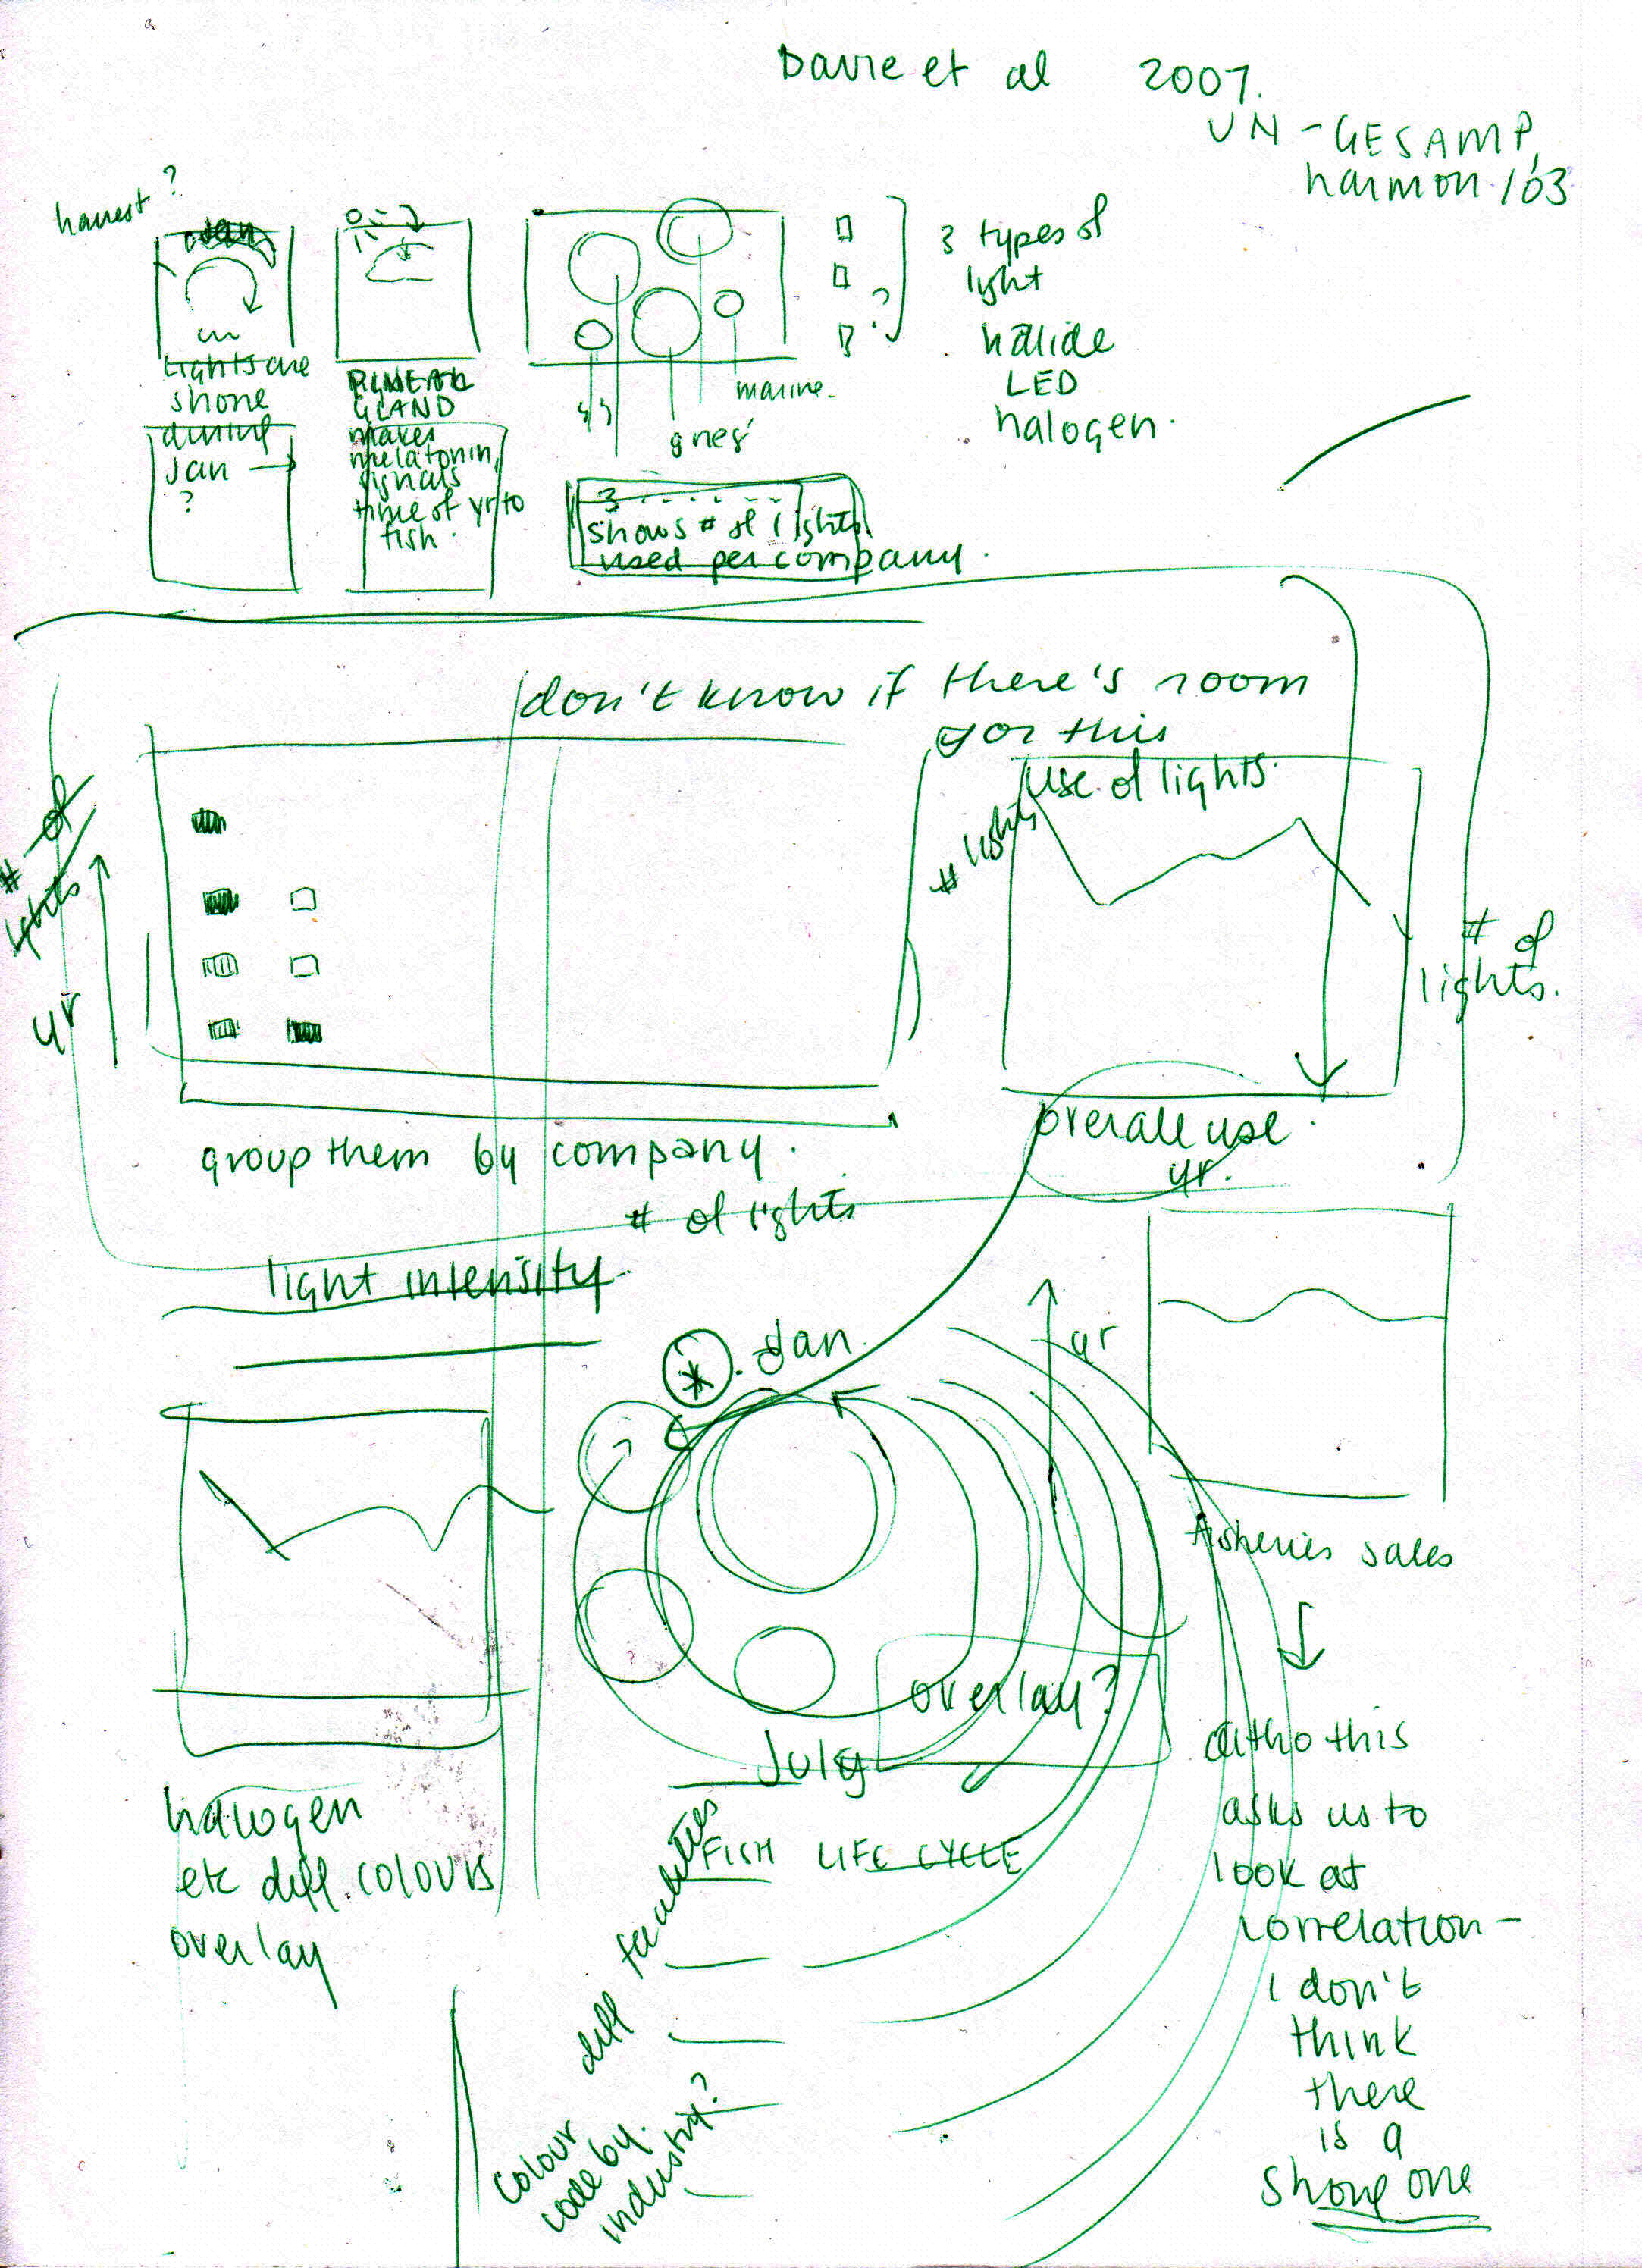
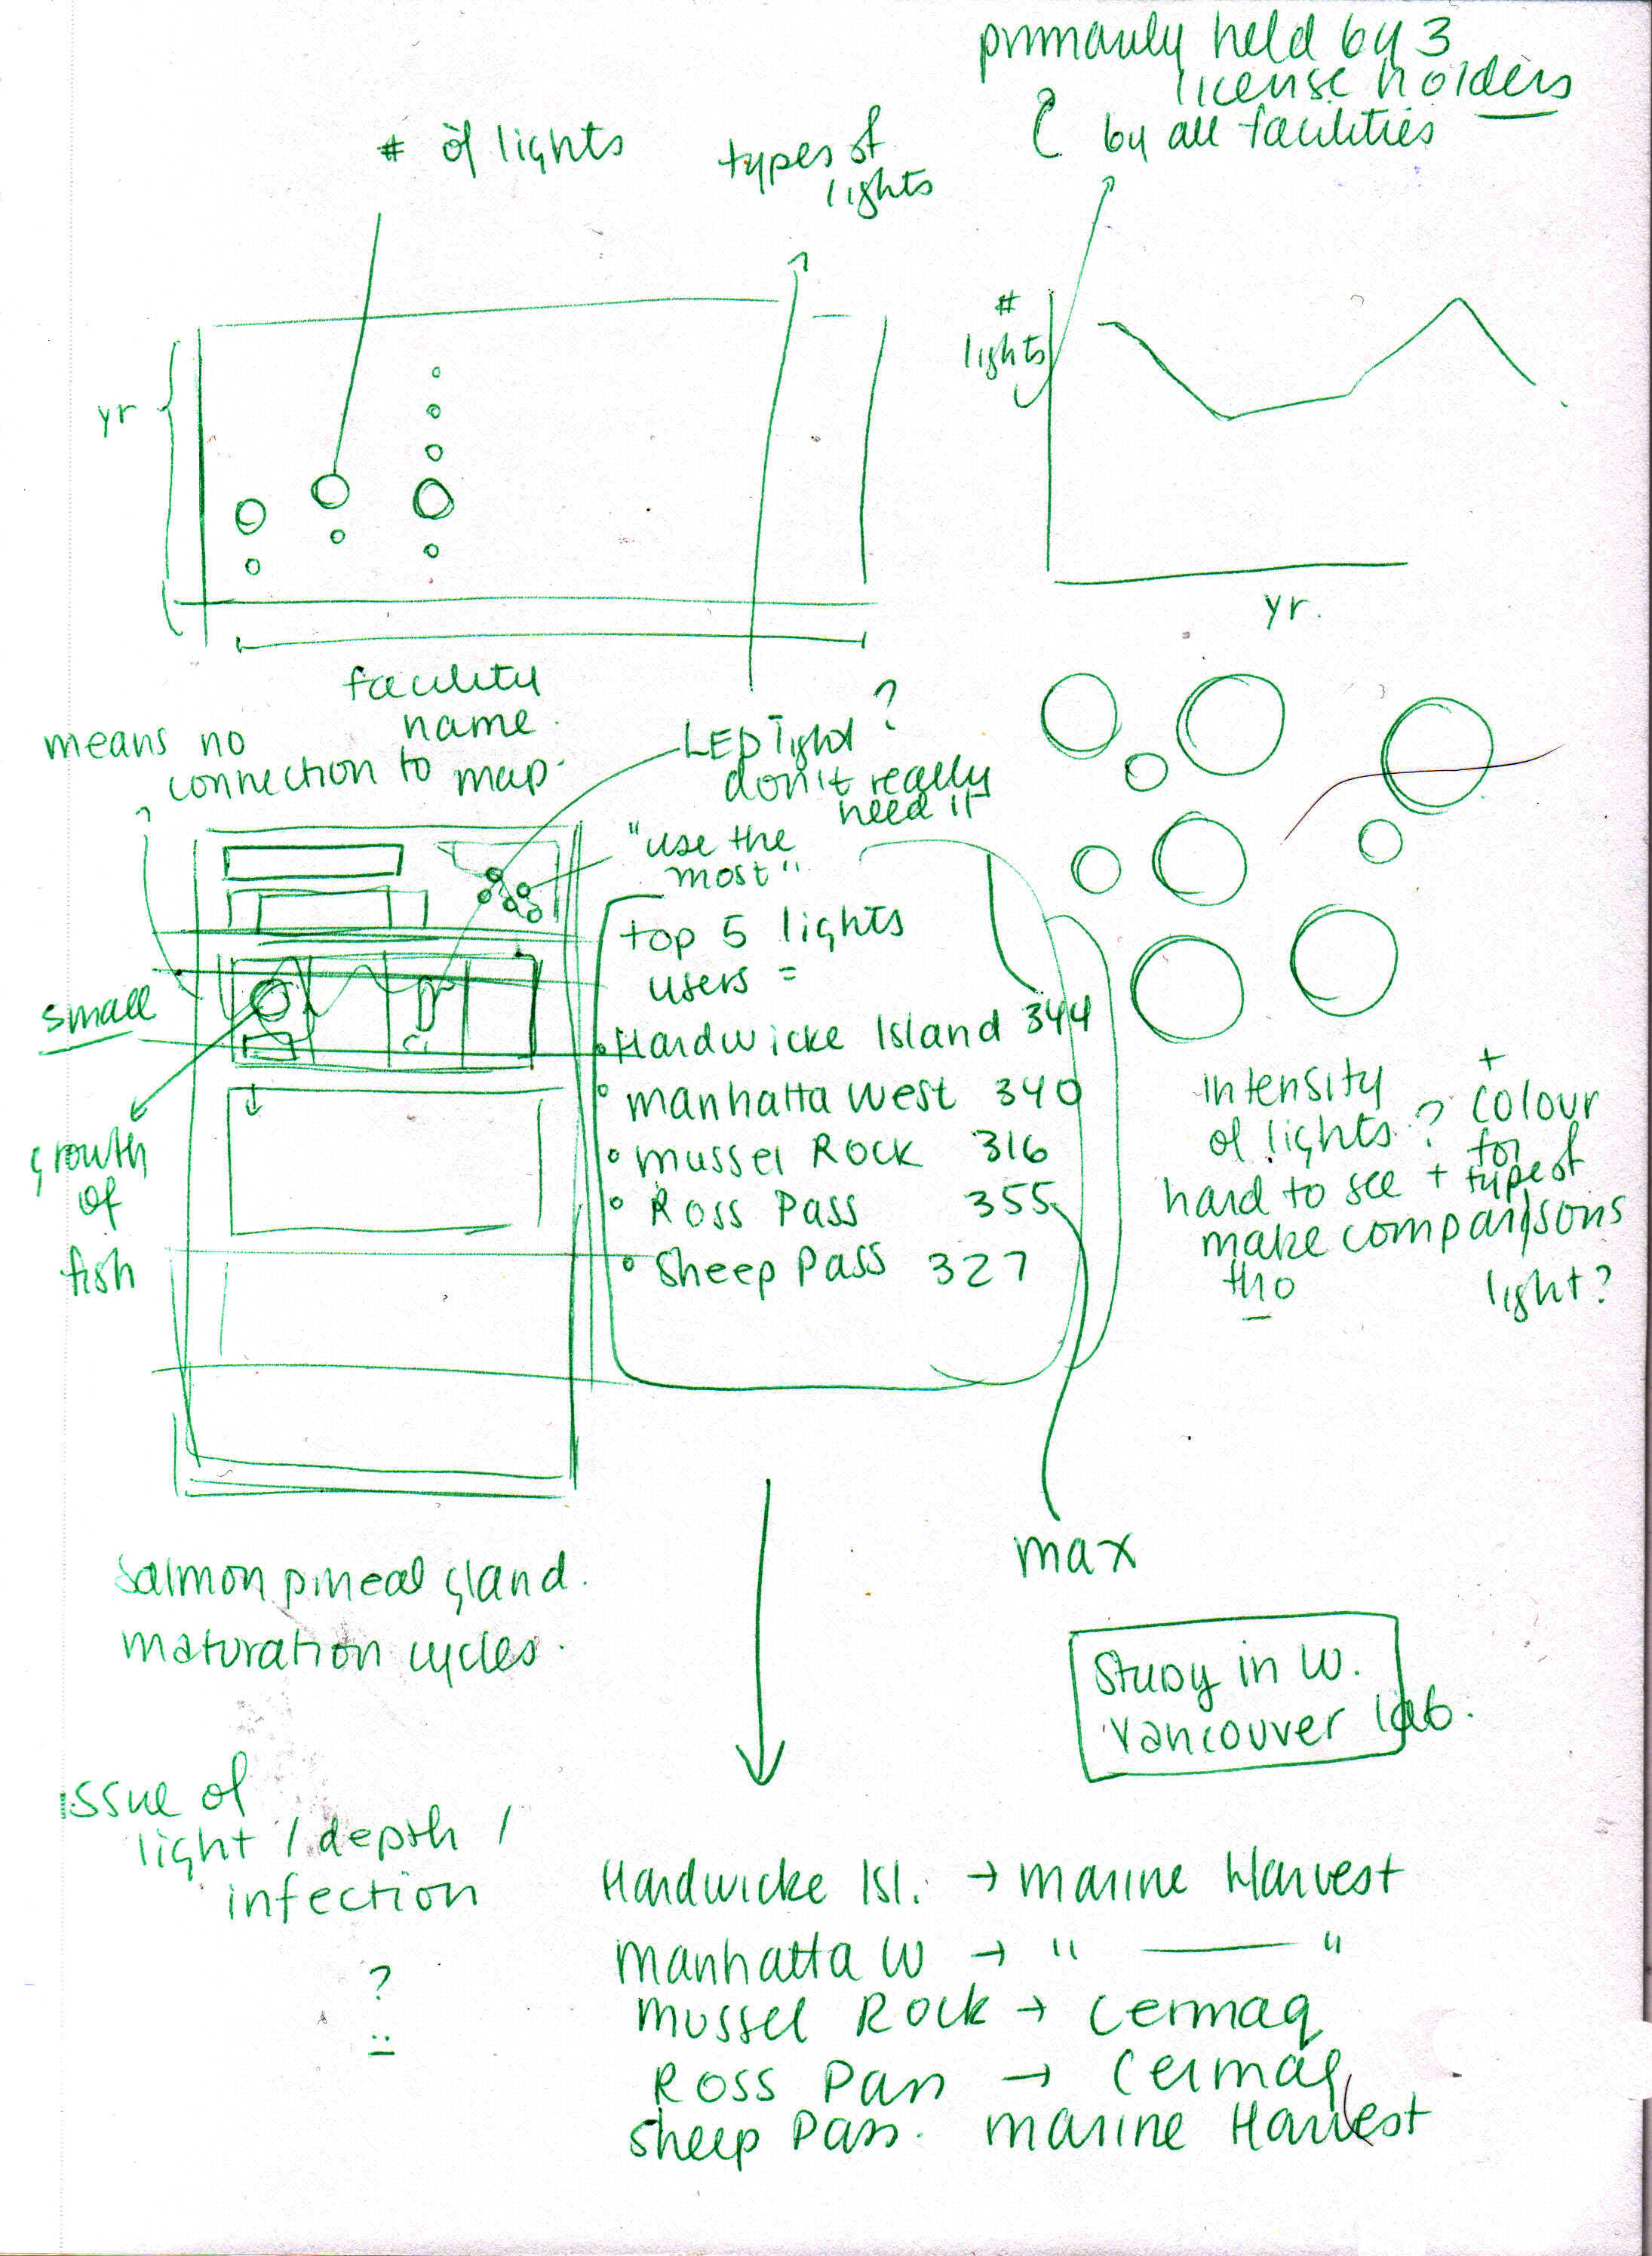
This piece visualizes facts relating to the use of lights by B.C. salmon aquaculture farms to alter the circadian rhythms, and thus growth patterns, of salmon to produce optimal growth.
This data visualization also explores different types of lights used, as well as the timing and number of lights used, against the patterns of fish sales by the top companies from 2011-2015.
Client: Prof. J Jenkinson
Adobe Illustrator
2017

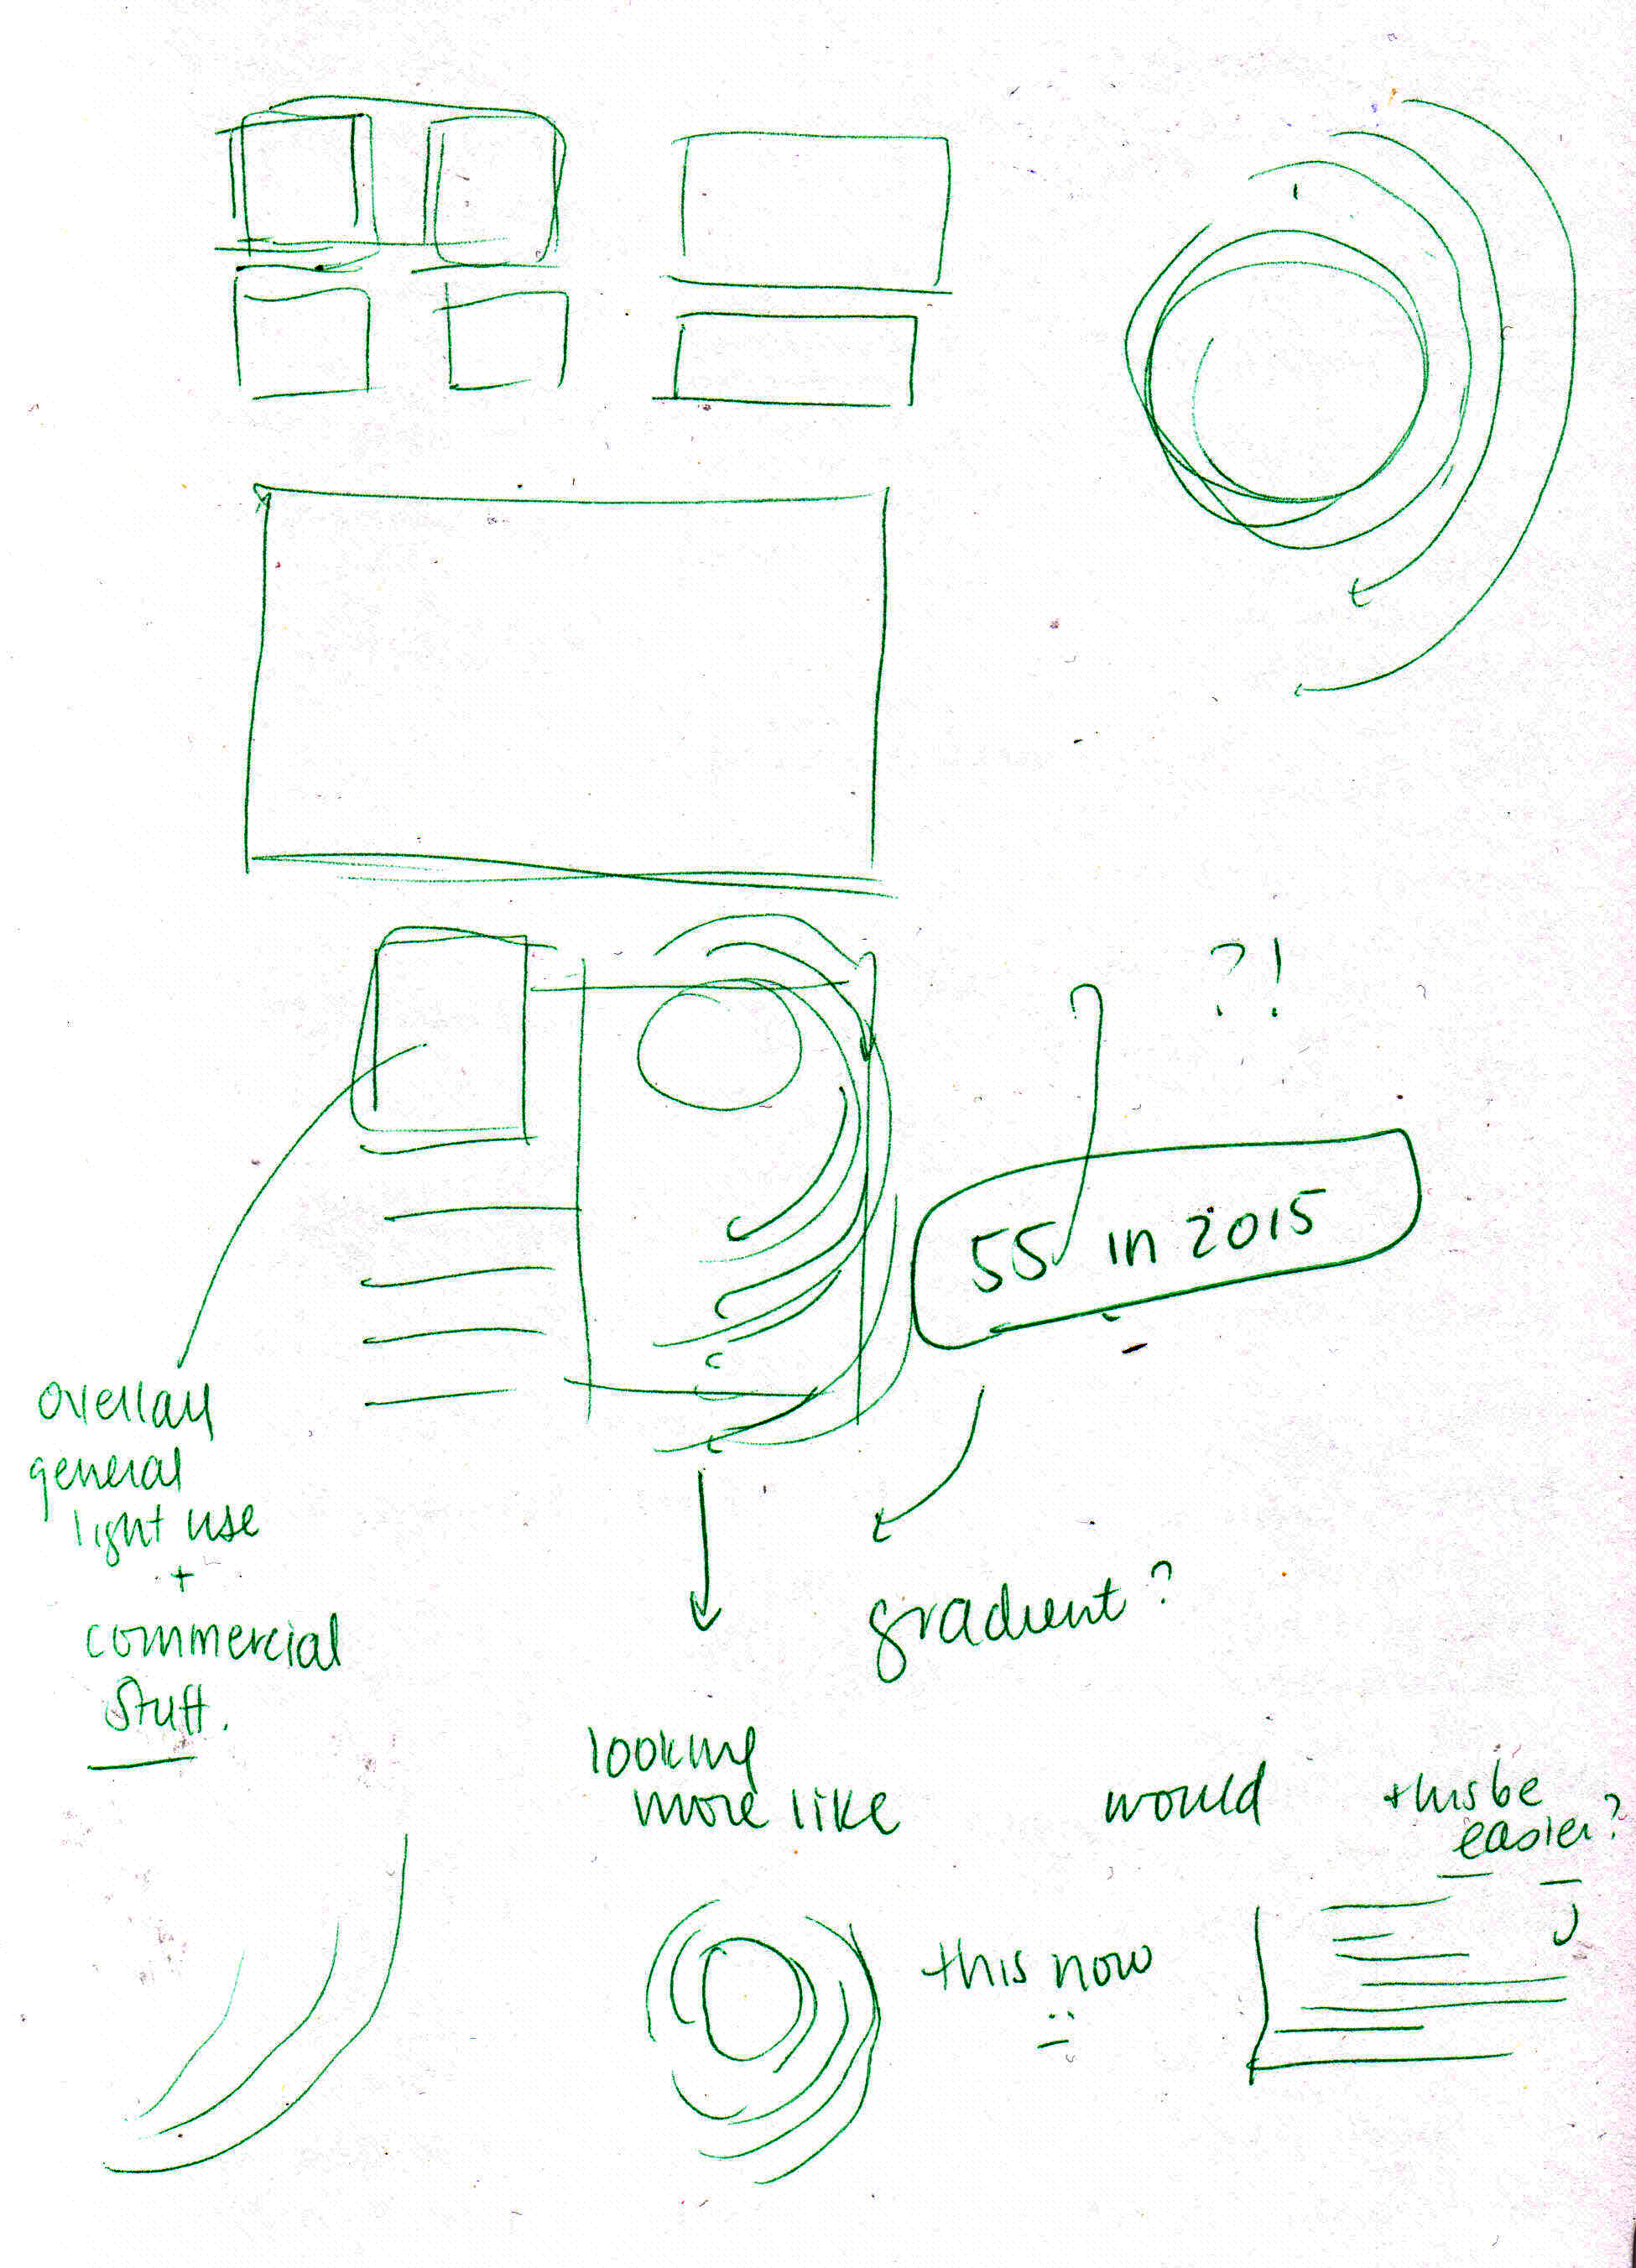
PROCESS WORK